


- sales/support
Google Chat:---
- sales
+86-0755-88291180
- sales01
sales@spotpear.com
- sales02
dragon_manager@163.com
- support
tech-support@spotpear.com
- CEO-Complaints
zhoujie@spotpear.com
- Only Tech-Support
WhatsApp:13246739196
- Purchase/Shipping/Refund
WhatsApp:13424403025
Raspberry Pi ------ 4.7 OLED display raspberry pi status User Guide
7 OLED display raspberry pi status
The Raspberry Pi RGB_Cooling_HAT needs to be properly plugged into the GPIO port of the Raspberry Pi and open the Raspberry Pi system I2C function.
This experimental phenomenon shows that OLED display CPU usage, CPU temperature, running memory usage, disk usage and IP address of the Raspberry Pi
1. File transfer
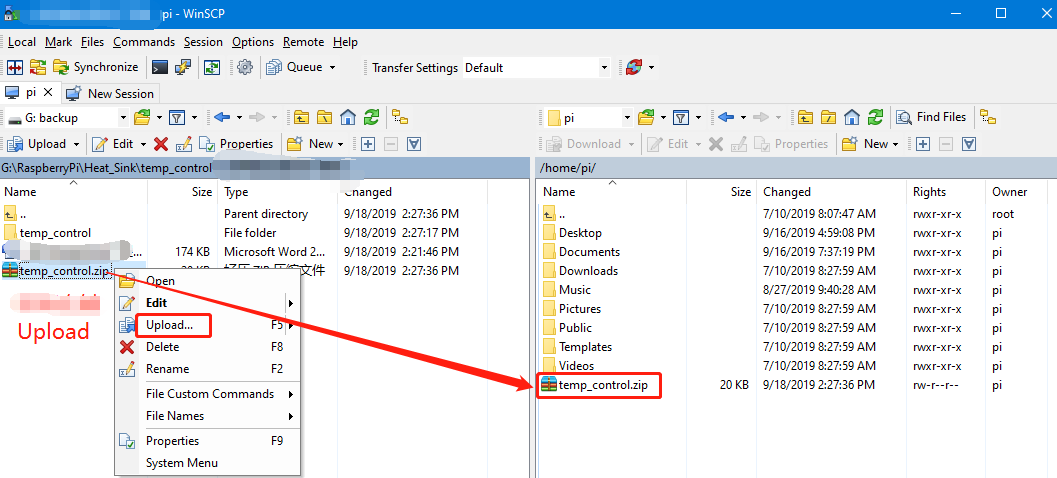
1.1 Install WinSCP tool on the computer side, connect the Raspberry Pi and transfer the temp_control.zip package to the pi directory of the Raspberry Pi.
Path of WinSCP:[Raspberry Pi RGB_Cooling_HAT]---[Tools]---[winscp556_setup.1416364912.exe]
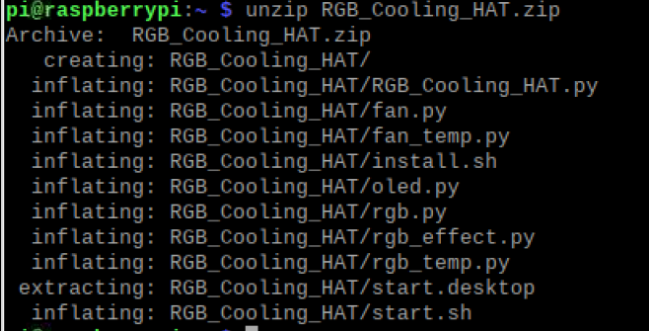
1.2 Extract file
Open the Raspberry Pi terminal and input command ls to find the RGB_Cooling_HAT.zip file.
As shown below:

Input command to extract file:
unzip RGB_Cooling_HAT.zip
2. Compiling and running program
2.1 Input command to enter RGB_Cooling_HAT find file.
cd RGB_Cooling_HAT/
ls

2.2 Input command to run program.
python oled.py
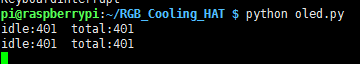
We can see that OLED display CPU usage, CPU temperature, running memory usage, disk usage and IP address of the Raspberry Pi.
3. About code
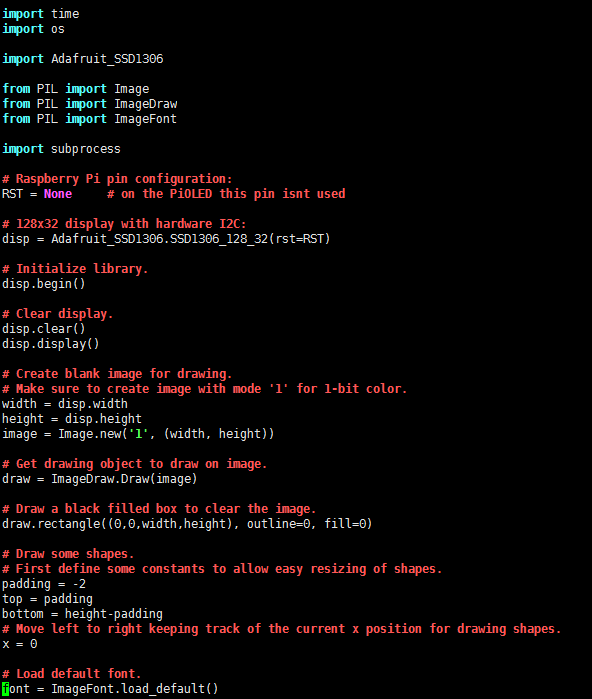
3.1 Import the time module for delay. Import the os module for access to operating system services. And import the library used by the oled display.
SSD1306_128_32 represents the initialization method of the 128×32 resolution screen.
3.2 To read the CPU usage.
First, open /proc/stat file. This file save the CPU activity information.
All the values of this file are accumulated from the system startup to the current moment.
Enter cat /proc/stat in the terminal to check CPU activity data:
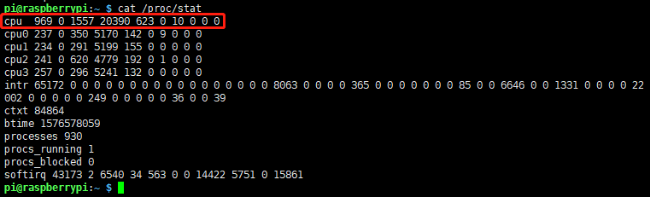
To calculate the CPU usage, we only need to use the top row of data. In this course, I will only explain the meaning of this row of data.
(Jiffies is a global variable in the kernel, used to record the number of beats generated since the system started up. In Linux, a beat represents the minimum time slice of operating system process scheduling.
Different Linux kernels may have different values. 1 jiffies = 10ms)
Parameter | Analysis (unit: jiffies) |
user(969) | From the system start up to the current moment, the running time in user mode, which not include the process with a nice value. |
nice(0) | From the system start up to the current moment, nice value is CPU time occupied by processes negative. |
system(1557) | From the system start up to the current moment, running time in the core state |
idle(20390) | From the system start up to the current moment, waiting time other than IO waiting time |
iowait(623) | From the system start up to the current moment, io waiting time |
irq(0) | From the system start up to the current moment, hard interrupts time |
softirq(10) | From the system start up to the current moment, soft interrupts time |
stealstolen(0) | The time spent in other operating systems when running in a virtual environment |
guest(0) | The Time to run the virtual CPU of the guest operating system under the control of the Linux kernel |
The calculation formula of the total CPU time (cumulative value):
Total Time = user+nice+system+idle+iowait+irq+softirq+stealstolen+guest
We need to calculate the current CPU occupancy rate by reading the above parameters.
Since it is accumulated from the system start up to the current moment, the difference between the two parameters collected through a short time (1 second) interval can be calculate the total amount of CPU time total.
Then, calculate the idle time idle in the same way.
Finally, the CPU usage rate=100*(total-idle)/total.
In addition, you can also directly enter the command to view the current CPU usage on the Raspberry Pi terminal.
You can display the CPU usage by entering the following command.
cat <(grep 'cpu ' /proc/stat) <(sleep 1 && grep 'cpu ' /proc/stat) | awk -v RS="" '{print ($13-$2+$15-$4)*100/($13-$2+$15-$4+$16-$5) "%"}'

Code:
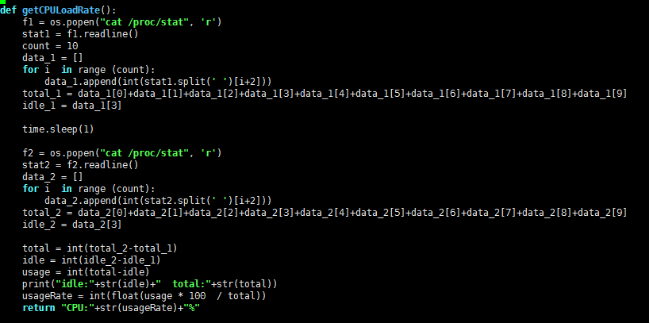
Obtain the CPU file information through os.popen, and only read the information in the top row to stat1.
Read the information of stat1 to the date_1 list, and then calculate the total_1 and idle_1 of the first reading.
Then, delay by 1 second(the tested data will be invalid if the time is less than 1 second).
Next, save the second reading data in total_2 and idle_2.
Finally, calculate the value of CPU usageRate.
3.3 Read the running memory occupancy rate, get the result of the specified command through subprocess.check_output, cmd defines the command to get the memory ratio of the specified format;

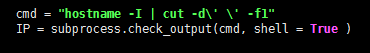
3.4 Read the IP address, you can display the IP address of the network cable and WiFi network.
Display network cable IP address has higher priority
5. Get temperature.

6. Read disk space.

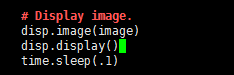
7. Display this message on OLED.
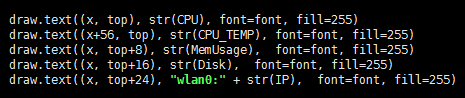
The draw.text() function is to set the content displayed on OLED.
The first parameter is x, which controls the left and right offsets;
the second parameter is y, which controls the upper and lower offsets;
the third parameter is the string, which is what to display.
Finally, you need to run the disp.display() function to refresh the display.